Seasonality Watch: Four charts that will make you go hmm…


Inflation remains the KEY driver of everything across assets. This has been evident throughout the beginning of 2023 as equities have recently sold off despite a pretty decent comeback to growth (on the surface). A sell-off ignited just because inflation allegedly re-accelerated alongside it.
We find several similarities to the surprising spike in prices in August/September after the first peak in annualized price pressures in June-2022. After all, disinflation was never going to occur in a straight line.
Let’s have a look at a few interesting observations which may make you more comfortable on the inflation outlook.
Chart 1. Perfect inverse relationship between S&P 500 and inflation since 2021
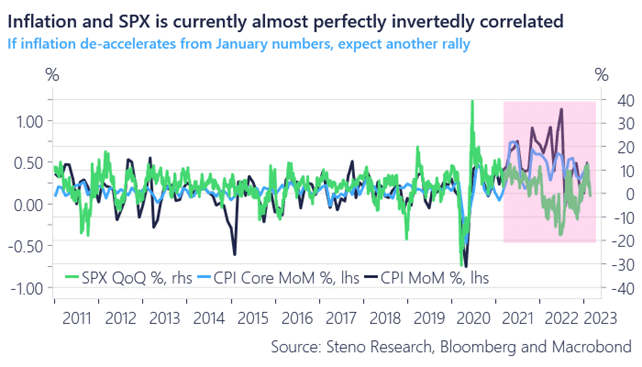
Our working hypothesis continues to center around the current inflation pick-up resembling the September report from 2022 (released in October). Here are four charts that will make you go hmm…
0 Comments