USD’O’Meter #3 – Continued USD weakening ahead based on our probability weighted models


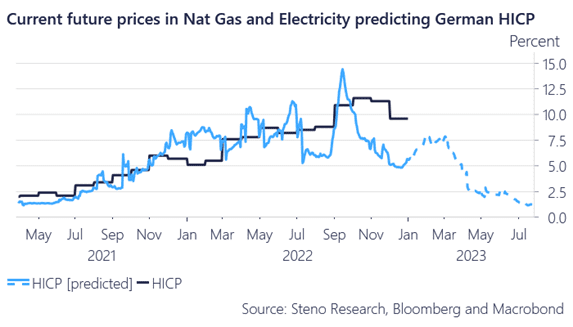
In the beginning of the new year we flagged USD weakness using our Waller Rule and one and a half months later that conviction is still merited. Firstly, we see base effects in energy bringing downwards pressure on EZ inflation given last year’s spike around the Russian invasion of the Ukraine last February.
Looking further into the summer we find that the current future pricing of electricity and natural gas point to inflation below 2 % given base effects from last summer’s madness in these markets. Now, do we believe EZ headline inflation hits 2% this summer? Properly not, but fact is the US will not be alone in seeing dropping inflation prints this spring.
The big difference is that the cocktail of rising core and rapidly slowing headline is currently the name of the inflation game in Europe (Just see the Swedish numbers released earlier today), while the two measures move more in tandem in the US. This is likely going to allow the ECB to remain hawkish for longer than the Fed.
Bottom-line: Relative inflation remains EUR positive vs. the USD
Chart 1. German headline HICP to fall off a cliff due to energy base effects?
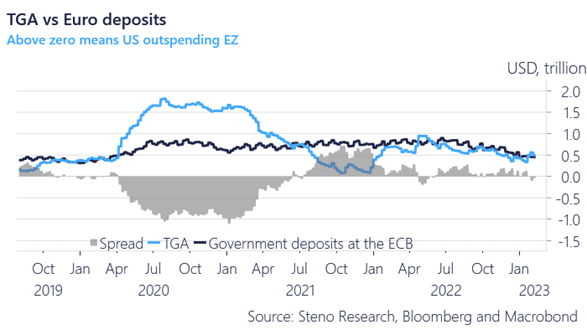
After seeing a massive TGA drawdown in 2021 we are back to an equilibrium in terms of fiscal drawdown from government deposits between Europe and US.
Even the recent forced drawing of the TGA due to the debt ceiling hasn’t seen the US winning the spending war. Thus we don’t see fiscal spending in the US adding pressure on the Fed for further rate hikes which in turn allows the ECB to ease its own hiking.
The big difference is that the US Treasury will be forced to draw down on the TGA in coming months, while European counterparts will likely voluntarily allow the EUR TGA to dwindle mildly.
We expect another liquidity addition of around EUR 100bn and USD 350-400bn from the respective Treasuries before the trend is FULLY exhausted during the spring.
Chart 2. Who’s the biggest spender?
What is the USD outlook given current liquidity gauges and economic conditions around the globe, you ask? Well that is why we have the Dollar O’Meter where we’ll look at the USD through different lenses.
0 Comments