Rates Watch: Will curves bear-steepen if the cyclical rebound is confirmed?


Welcome to this second asset-specific piece during our “Business Cycle Week”.
Due to several of our indicators hinting at a short-term pick-up in cyclical activity (manufacturing), we take a look at every single major asset class and how it’s priced relative to the cycle outlook. In this piece, we will look at rates/curves relative to the cyclical outlook. You can find the entire series on this link.
Key takeaways up-front:
– The inflation impulse has outpaced the growth impulse for longer bond yields since 2021, making it difficult to assess the direction for rates if growth rebounds and inflation fades (the Goldilocks scenario)
– The curve is likely to steepen both in a recession and in a rebound scenario, making the curve shape easier to trade than the nominal direction of yields
– If ISM Manufacturing rebounds to 55 while core inflation “lands” around 3%, we see 10yr bond yields 100-120bps higher than today based on empirical studies.
Let’s have a look at why..
The growth impulse is secondary to the inflation impulse currently
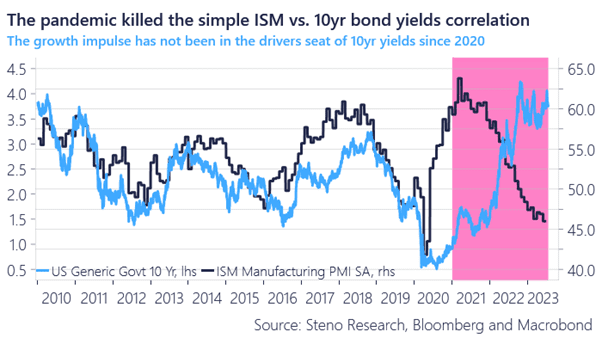
Those of you who have several IB relationships will probably know the below chart by heart already. The relationship between 10yr bond yields and the ISM index was super neat between 2010 and 2020 and right about every sell-side strat posted this chart on a regular basis.
The correlation broke down when inflation arrived due to the pandemic policies and the question is now whether the relationship between the growth impulse and 10yr yields will continue to be distorted.
Put in other words, the growth impulse is now not the only game in town for long bond yields as the inflation impulse matters again after a decade of non-existence as a driver. On a stand-alone basis, it seems like long bond yields discount a cyclical rebound already, but that would be too weak of an analysis given the inflation impulse.
Chart 1: ISM vs 10yr bond yields
If we indeed get a short-term cyclical rebound, the yield curve is going to be tested. Does a hugely inverted curve rhyme with a rebound in manufacturing? Probably not. Let’s have a look at it.
0 Comments