Inflation Watch: 7 charts on EUR inflation after smoking hot prints from Spain and France

Another smoking hot inflation print out of France and Spain in February this morning of roughly 1% on a month on month basis.
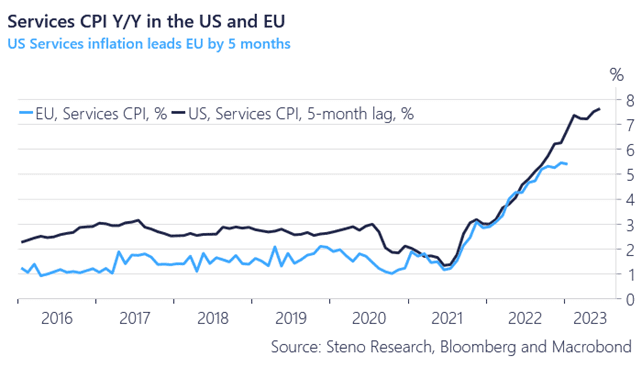
Our hypothesis for H1-2023 has been that US core inflation would lead European core inflation by around 5-6 months (and APAC/Japanese core inflation by 10-11 months)
This pattern continues to hold and would suggest a peak in EUR core inflation around 6% in 3-5 months from now.
Chart 1. US leads Europe by 5 months

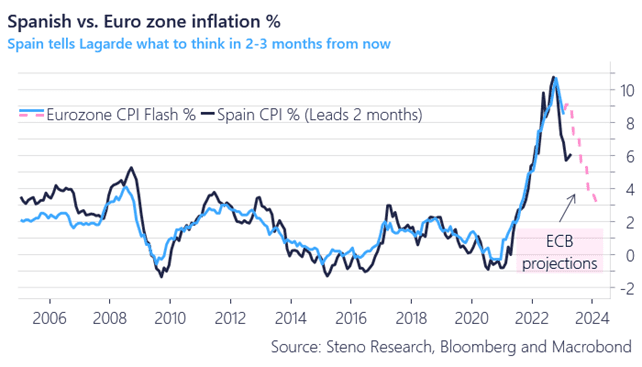
The headline inflation in Europe will inevitably come down in March/April due to bizarre base-effects from the invasion spike, but that is essentially already a known, why it should not come as a surprise to markets and the ECB.
Prices rose 2.4% in March 2022, which will allow for a substantial softening of yearly price pressures in a month from now, while the Spanish experience do offer some conciliatory vibes for headline going 1-2 months forward. The slowdown in headline inflation is mostly on par with expectations from the ECB projections in December (see chart 2).
Chart 2. Spain leads Europe, but the slowdown is expected by everyone

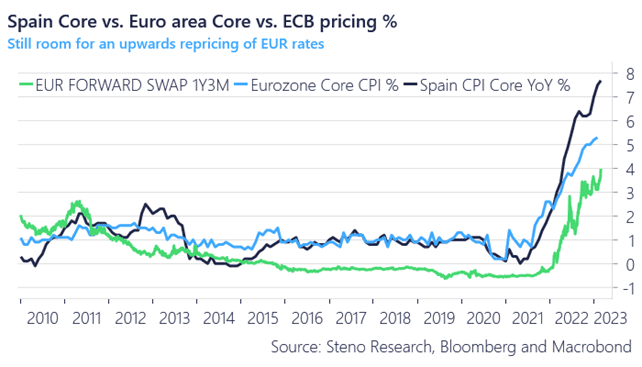
The interesting thing is to look at core inflation relative to the staff projections of the ECB.
The ECB expects 2023 core inflation to average around 4.2% and Lagarde hinted in December that the ECB could be willing to take the policy rate to positive territory relative to the core inflation forecast.
We are now pricing a roughly 4% peak in the ECB rate, which leaves 25-30 basis points left on the trade just based on the December projections from the ECB, which will likely be increased a bit in March.
Chart 3. ECB pricing lags inflation

Find out below how we trade the current ECB setup.
Service inflation is feeding through to Europe in size now, which makes the case for further ECB tightening compelling. Here are 7 charts on EUR inflation ahead of the Euro-zone print on Thursday and what it means for markets


0 Comments