9 charts on the US CPI report: Enough downside to prompt a skip !


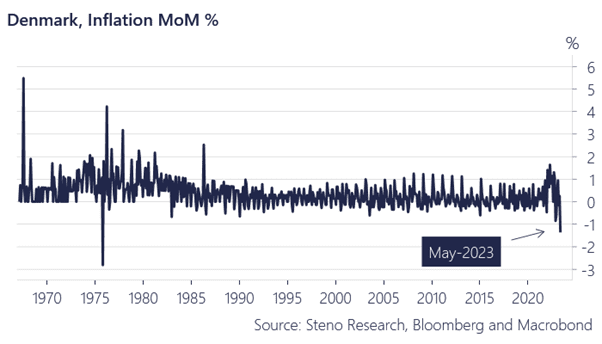
The evidence on inflation gathered through the month of May has been extremely dovish. Will the US numbers follow suit? Take a look at Danish inflation released this morning. Finally, a decent chance to show a chart from my neck of the woods. Historical deflation.
Chart for thought: A new record monthly deflation in Danish CPI
We see a high likelihood of US inflation printing below consensus as the broadening of the disinflation theme has continued through May. The April CPI report was held up by Gasoline and Used Cars – both of which have changed trends since the April report. Outside of gas and cars, the April report already showed clearly weakening inflation trends.
We see headline inflation printing at 4.0% max and core inflation at 5.0% or 5.1% – clearly below consensus. Let’s have a look at some charts on why (get access with af 14 day FREE trial below).
Chart 1: US CPI decomposed
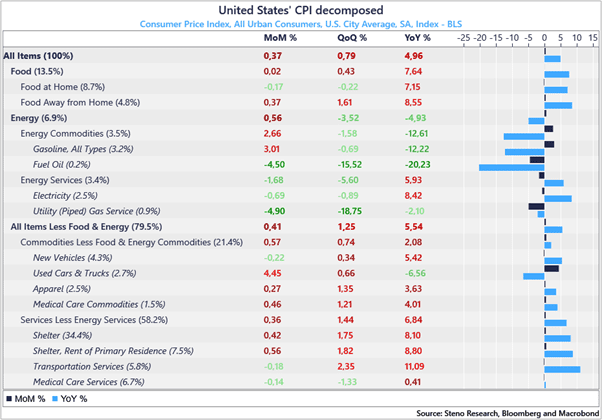
As per usual ahead of a CPI report, we deliver the best charts on the USD inflation outlook. With May inflation coming in low across the globe, we see clear downside risks to the inflation report consensus.
0 Comments