Brief Inflation Watch: Smack dab at our soft forecast!


Moments ago we had June CPI printing almost spot on our forecasts! 3.0% and 4.8% YoY for headline and core respectively. Let’s briefly touch down upon some of the figures.
Here is a full overview of the developments in subcomponents of the report.
A drop in used and new cars as we expected, and also a material slowdown in transport services to 0.13% MoM. Smack dab at our forecast. It is very likely that core inflation will print between 0.1 and 0.2% MoM from here as used and new cars will drop even more in coming months. Based on high frequency data, June showcased the largest monthly drop in car prices in newer history.
Chart 1: Decomposed CPI overview

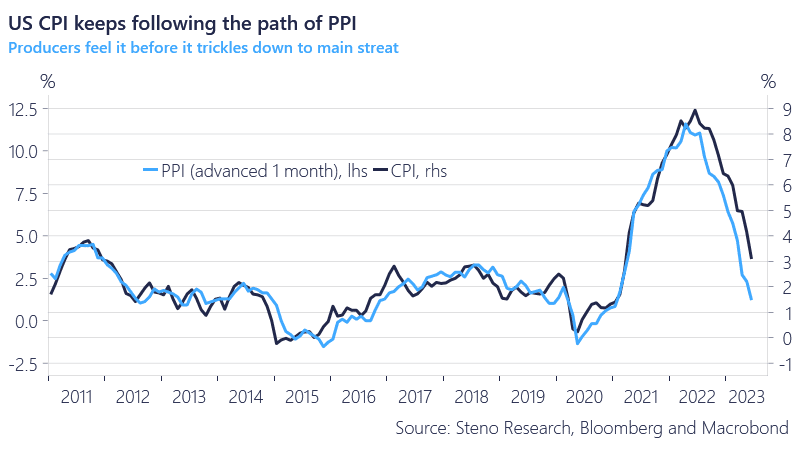
The historically strong correlation between CPI and PPI was reaffirmed today, and according to producer prices received, US inflation will again be below the 2% threshold within the year. May give way to a slightly less hawkish rhetoric from the FOMC soon.
Chart 2: PPI trickling down to CPI still
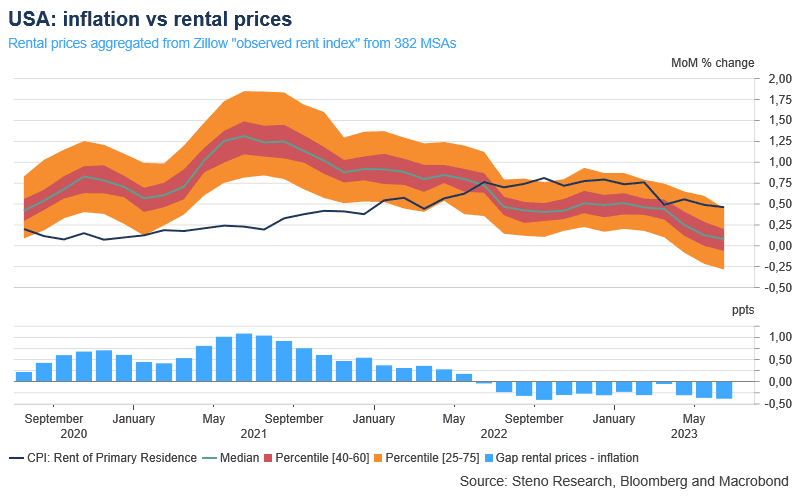
We are still waiting for the costs of shelter and rent of primary residence to go ‘timber’, but we are perfectly aware of the latency in the surveys, which the Fed prefers, relative to those observed. We can thus expect the ‘actual’ current costs to show in the reports some 9-12 months from now.
All boding well for the continued disinflationary path which, from a policy stance, may turn out to have been overdone. Something we see increasing risks of and have been particularly vocal about.
Chart 3: Inherent lags in shelter/rents may pose a risk
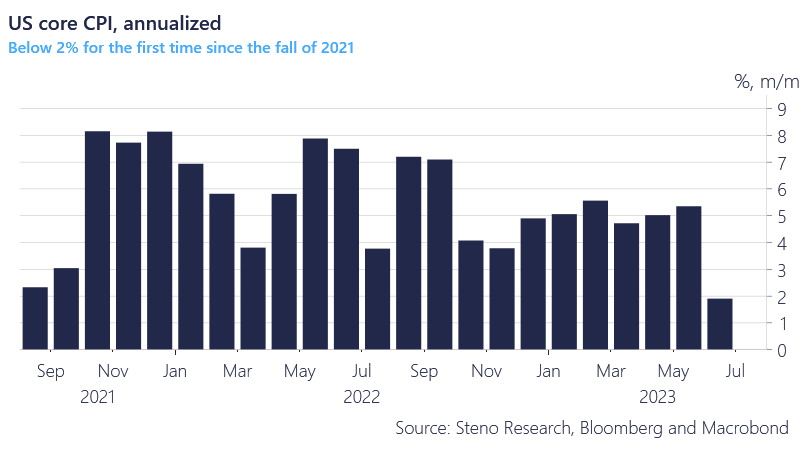
Looking at core inflation, we are printing below 2% on an annualized basis for the first time since the fall of 2021 and based on this and the strong jobs numbers, we can all finally agree to lay the Phillips Curve to rest for good. Also, this print along with the headline inflation print suggests that the Fed needs to pause now given it has reached its inflation target of 2%.
Chart 4: Yuuuuge drop in m/m core CPI annualized and now below Fed 2% target
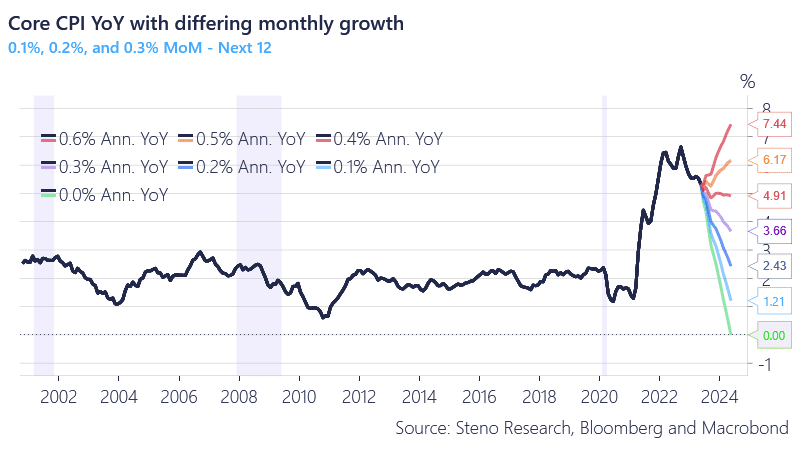
On a final remark we might add that an annualized core inflation >2% relies on MoM at or below 0.17%. All good for now, but hiccups from base effects could spell trouble ahead – at least in headline. An underlying core inflation trajectory of 0.2% MoM should be clearly within reach now.
We remain long USD duration both directly and via proxies and find our views reaffirmed by the US CPI report today.
Chart 5: Core inflation trajectory given differing MoM
Just in: A brief account of today’s US CPI report.
0 Comments