Positioning Watch: How big were the SVB flows?


Boy, oh boy, what a turbulent conclusion to last week.
The more we look at the Silicon Valley Bank case, the firmer we get on the conclusion that the SVB was driven by a bunch of risk loving amateurs. Running an unhedged treasury/banking book as about as bizarre as it gets, and no big systemic bank would ever be allowed to run similar duration risks in the current regulatory regime. We will be back in Steno Signals tomorrow with our take-aways on portfolio compositions after the turbulence.
In this piece we want to take a look at positioning and flows after this turbulent week. CFTC positioning data still lags (more than usual), why we supplement with our own flow-based positioning indicators.
Let’s get to it.
Equities: Flows not as negative as one would have expected
– Net weekly flows were positive on the week up until yesterday but flows showed material selling in the SPY on Friday, while Nasdaq and Russel flows were less brutal on Friday.
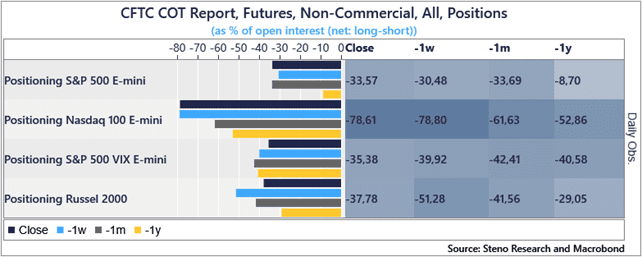
– Positioning is already clearly short/underweight in equities, especially in Technology and Consumer Discretionary
– The SVB is NOT a systemically important event, why already bearish positioning will likely prove to be a cushion on the downside
Chart 1: Equity net flows as % of aggregate flows
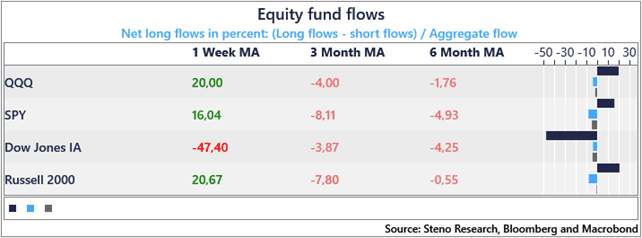
Chart 2: Net position as % of open interest in equities
Find positioning indicators for FX, rates and commodities below.
Let’s have a look at our flow -and positioning indicators after a week of market turbulence. How big were the SVB-fueled flows on Thursday and Friday? We look across assets in this analysis.
0 Comments