Energy Cable: Inflation starting to bite equities


Hi everyone and welcome to this week’s energy cable from a sunny and cold Copenhagen. If you haven’t yet, I’ll recommend that you read our update on shipping markets from last week here and also give you a heads up on our free macro nugget where we regularly post a nugget of the stuff that we look at. You can subscribe to the macro nugget here.
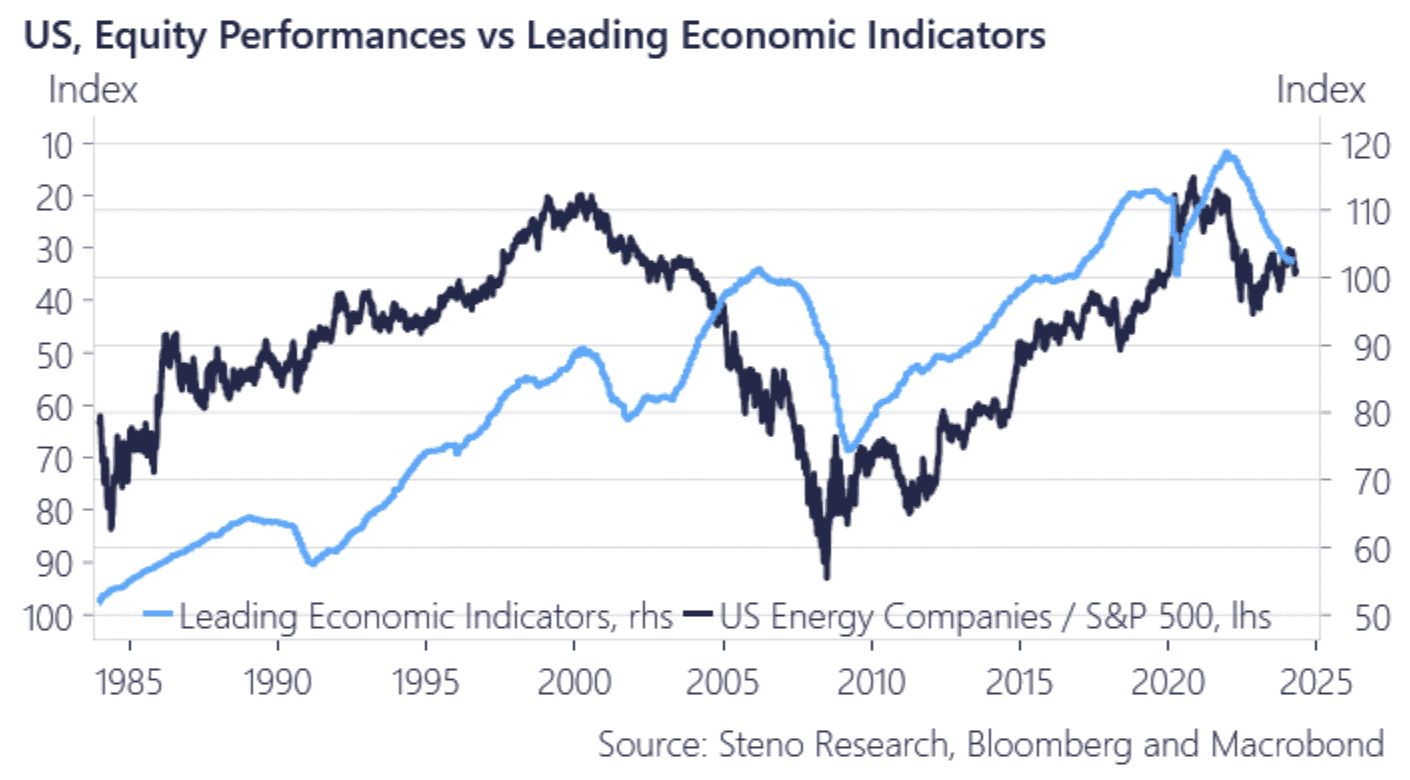
Calmness returned to pockets of cross asset markets last week. The long end of the US yield curve got off its highs, crude got back under USD 90 and equities are left as the only truly hurt asset with SPX dipping under 5k for the first time since Feb. Month-to-date, Energy remains the only sector in green, underlining what we have been saying since the inception of this newsletter: XLK/XLE is the new 60/40 portfolio. From chart 1.a we see that over a longer period of time energy outperformance has rhymed well with downturns in leading economic indicators in the US and it really is ‘duck for cover’ time when energy is ripping.
Looking at 1 year equity risk premia in the US we see that active managers in equities and fixed income are pricing an outperformance of short term US government debt against the broad market. If active market participants become more and more fearful of inflation then they will likely seek into assets that still yield a positive equity risk premium or position themselves in risk free assets.
As we have talked about before, we think the long end of the US yield curve will play an important role in determining if we reach the 2% inflation target. The long end is what matters for car loans and mortgages, it determines equity performance and it plays a role in terms of debt financing for companies, which have all played a part in keeping inflation elevated. Thus, if the long end is heading for > 5%, as XLE suggests per chart 1.c, then it should be time to consider taking some asset allocation choices. Until then the full reflationary trade remains on.
Chart 1.a: Run for cover when energy starts to outperform
The rise in energy prices, the USD wreckingball and the higher-for-longer narrative has finally reached equities, which seems to be taking a bit of a breather here. We take a look at movements in energy and commodity markets once again.
0 Comments