Business Cycle Watch – Recession or rebound?


Welcome back to another business cycle-themed article post the business cycle week where we covered a potential rebound in manufacturing and what that might mean for assets in the time to come.
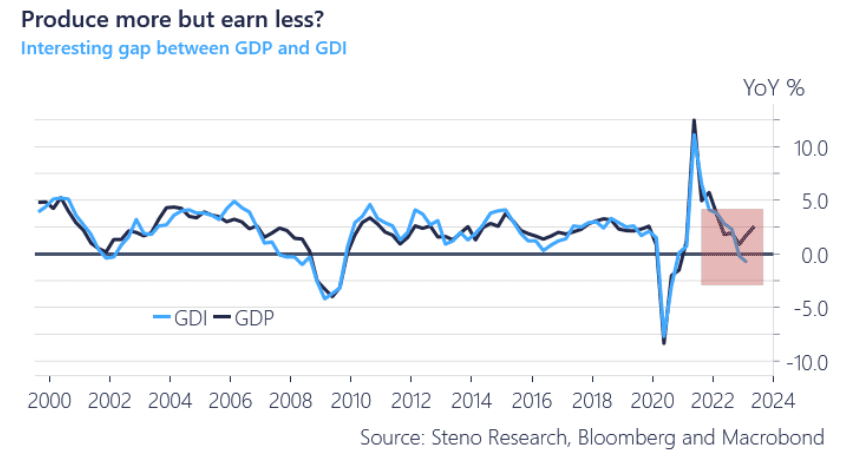
Today we shed some light on the kings of business cycle data – GDP and GDI – which are both widely known for being THE metrics to watch (together with the labor market) when assessing if the economy is actually slowing down or not. Normally the two follow each other quite closely, as they are conceptually identical, but currently, we are faced with an interesting gap with GDI screaming recession while GDP is hinting at a rebound amidst a skyrocketing fiscal deficit, higher public interest expenses and a much stronger labor market. Are the metrics the markets are looking at a false flag? And which metric should we trust when allocating our money?
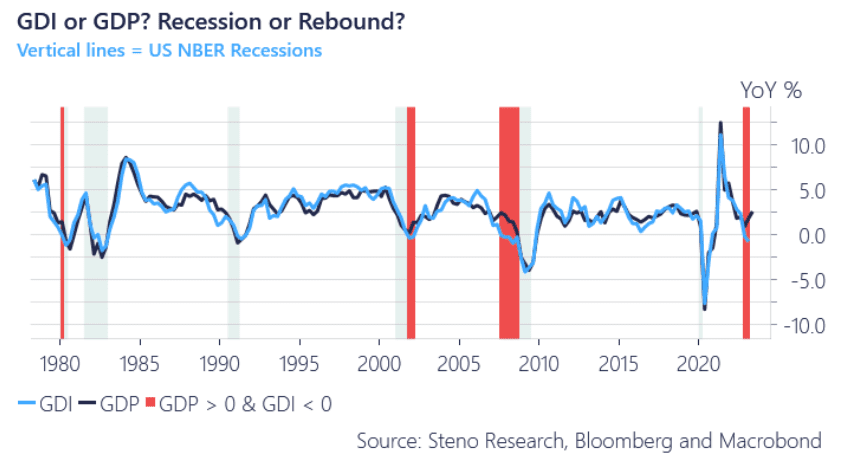
Chart 1: Recession or rebound?
If you were to judge based on the history books, GDI speaks in favor of the numerous recession calls made this year – every single time GDI has shown negative growth while GDP has increased YoY, we were either in a recession or close to one. So if you ask GDI, reducing risk will be the play.
Everyone seems to be stuck in the idea that the positive GDP growth seen recently is equal to a soft landing, but markets could make a u-turn VERY quickly should GDI be right.
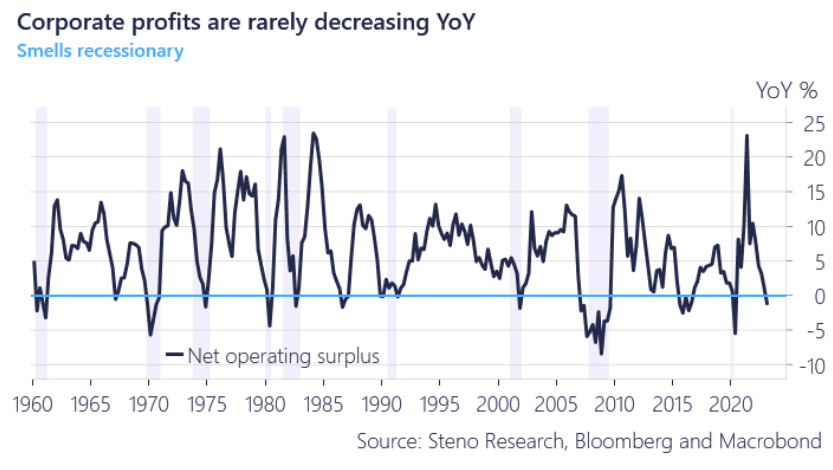
Chart 2: GDI is better at forecasting recessions
There have been multiple discussions in the scientific community about these discrepancies – an example being Nalewaik. The paper suggests that GDI is better at predicting economic downturns based on historical correlations with US recessions and on top gives a more precise picture of the economy as the advance estimate of GDI is in general a better indicator of domestic output. Definitely worth a read.
So, what’s left other than jumping right into the two measures and discussing why this discrepancy might have occurred.
GDI vs GDP – Definitions and differences
GDI and GDP are both measures of domestic output in an economy, with GDP measuring the value of goods and services produced, while GDI is the income that is derived from selling these goods and services. So in theory, they should be equal at all points in time. So why is there a gap? Let’s have a look at the definitions:
GDP = Private Consumption + Investments + Government spending + Net Exports
GDI = Wages + Profits + Taxes + Rental Income + Interest Income – Production / Import Subsidies + Statistical Discrepancy
Therefore, the big question to ask when assessing the prediction value of the two will be which variables are best at giving a real-time picture of the economy. Let’s assess them one by one.
GDP
GDP is the most well-known and used indicator of economic output and is also what forecasters and statisticians use when estimating and forecasting recessions and business cycles. But how does it look currently when you decompose the variable into its sub-components?
The last advance release showed a Q/Q annualized value of 2.4%, strongly indicating that we are heading towards a soft landing with the dovish inflation trends seen currently, but GDP may have some flaws in this business cycle.
GDP is heavily driven by private consumption, which accounts for ⅔ of the total number, so if private consumption growth is positive, so will GDP growth. What about the rest?
- Government spending: Government spending typically has little to no impact on the total GDP growth as the figure tends to grow at a constant rate. But since the US relies heavily on debt financing when it comes to public spending, the figure will not show decreases in tax income, which in general is a better indicator of current and future economic growth.
- Investments: Investments are widely known to be one of the main drivers of sustained growth, and we are now at 3 consecutive negative prints over the last 3 quarters. Doesn’t look too good even with headline numbers looking solid.
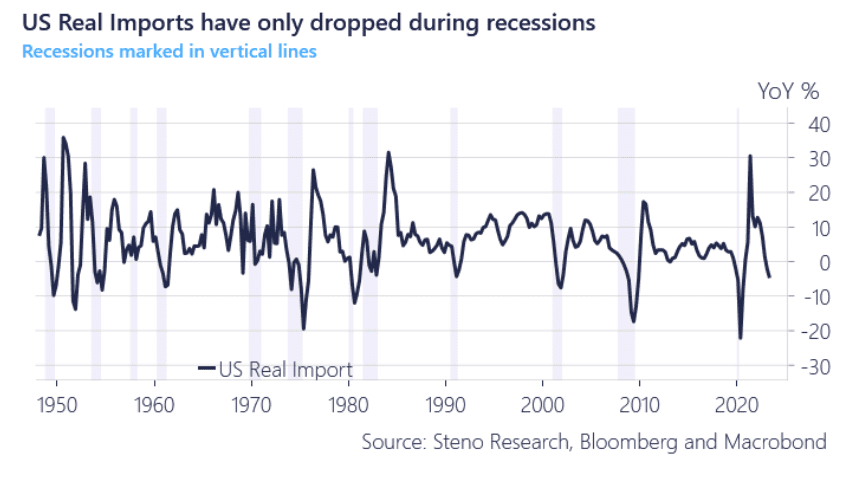
- Net exports: This is the really interesting figure when trying to figure out why GDI growth is negative while GDP growth is booming. We are currently seeing substantial negative growth in real imports (which is only occurring during recessions historically), which in general hints towards weakening domestic demand and household strength. But by definition, a decrease in imports is net positive for GDP if exports stay unchanged, meaning that GDP strength could be a false flag.
If you remove government spending and net exports, GDP growth is only at 0.8% YoY!
Chart 3: GDP could be a false flag
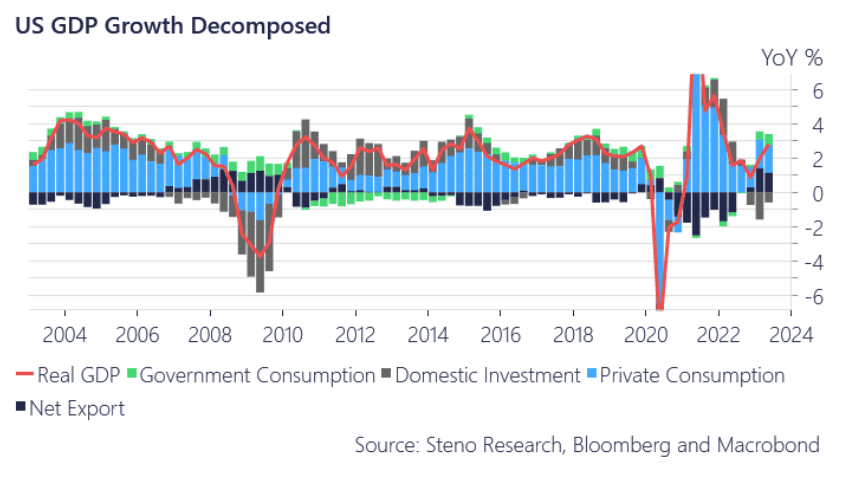
Chart 4: Real imports says that we are heading into a recession
GDI
So what about GDI? The subcomponents that actually add up to the total number can be quite tedious to find, but our estimate based on available BEA data with a historical correlation of around 0.85-0.9 is starting to hint of a slowdown in the economy based on income data. Let’s have a look at the main drivers and give our take on what that means for the time to come:
- Interest income is slowly but surely pulling down YoY GDI with 8 consecutive quarters of negative contributions, and with the decrease starting to accelerate now, credit creation could go from viable to undesirable.
- Wages are the biggest component of GDI as it is closely related to personal consumption, and is one of the only variables that shows some light in the end of the tunnel with the Q2 advance release showing a 2% contribution to GDI growth. So judging by this figure, GDI might look more like GDP next quarter, but…
- Profits are the game changer in this part of the business cycle. Corporate profits are rarely negative on a YoY growth basis, and we are starting to see the first signs of monetary policy getting to corporations. And if profits continue to wane, so will wages (eventually). And with subsidies gone, there is no one to save them this time.
- Worth noting that the statistical discrepancy (an adjustment measure made to fit GDI closer to GDP) lifted GDI massively last quarter. What if GDI is the most precise measure compared to GDP and not the other way around? Could be that GDP should get a statistical discrepancy built into the equation.
Chart 5: No help to get when subsidies are gone
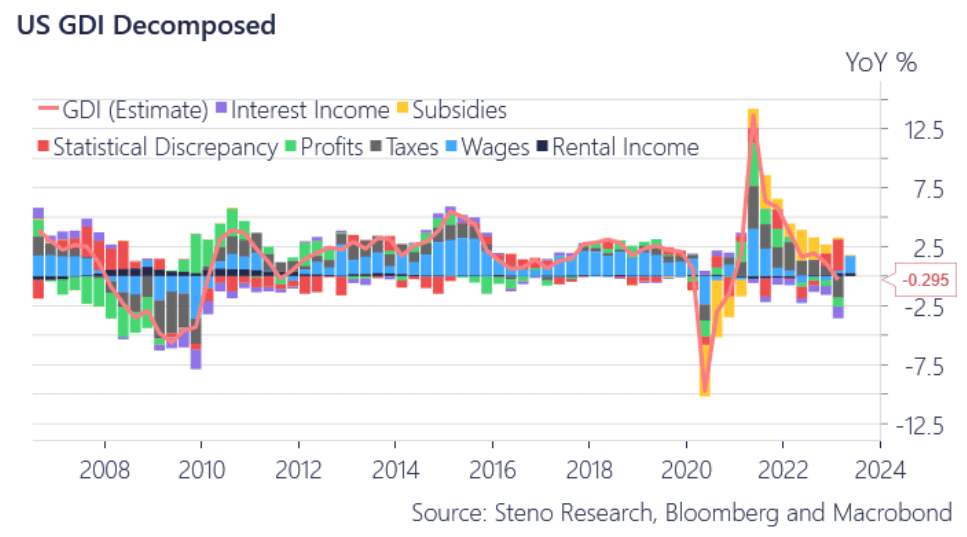
Chart 6: Recession incoming?
Heading to the conclusions: By looking at the data, we must admit that the GDI figure looks very compelling as an indicator of future economic growth compared to GDP, which is basically what the market is caring about. No one has looked at GDI it seems, and it might therefore be a good idea to start unloading some risk soon if wages can’t save GDI growth next quarter. GDP is in general lagging the real-time economy to some degree as the Investment component for instance can stay bullish for quite some time – inventories are counted in GDP even if they are not being sold during the year due to sluggish demand – and GDI looks like a better way of measuring the real-time economy (More production is fine, but if there is no one to buy the goods – which is the signal we are getting from GDI – we are in for a downturn). The markets are of course mainly looking at GDP so perhaps the GDI is a canary in the coal mine at this juncture?
An interesting gap is emerging between GDP and GDI, which in theory should be 2 conceptually equal measures of domestic output. Who’s right and who’s wrong? And where does this place us in the business cycle?
0 Comments