Shipping Watch: Consider buying your Christmas presents now!

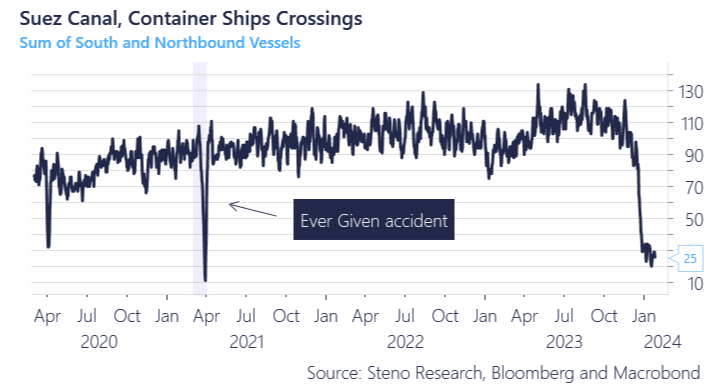
Let’s start with the current situation in the Red Sea. Things are very grim and the only container ships that currently dare to sail through the Red Sea are Russian due to their support of Iran and the Houthis. Yesterday a Maersk ship hauling US government cargo had to turn back in the Red Sea after explosions nearby. Even though the Maersk vessel was accompanied by the US Navy that didn’t deter the Houthis from attacking underlining how bad the current situation for global shipping is.
Chart 1: Things are really bad for containers in the Red Sea

Today the weekly freight rates were published and for the first time in over a month, the w/w print in Europe seems to have calmed down. Good news, indeed. But don’t celebrate just yet, as the China to Europe route is up more than 300% since the crisis started. Furthermore, we have seen spillover effects to the US and this week freight rates to LA and New York were up 12% and 8%, respectively.
Chart 2: Changes to freight rates in Europe w/w calmed down this week

So why should you buy your Christmas presents now? Well, we find some important reasons for that. First one is the direct consequence of increased shipping costs being transferred over to consumer goods. We have a clear-cut example of this during 2021 when the Ever Given accident helped ignite inflationary pressures by halting traffic at the Suez Canal.
Now versus 2021 of course differs in the way that back then everybody sat at home buying useless stuff off Wish with the GameStop gains, but with the Johnson Redbook and other live gauges of US consumption being up sharply YoY in January, companies in the US will be looking to pass over these prices as well.
Chart 3.a: Things setting up for consumer goods to rise?

Chart 3.b: Johnson Redbook up YoY

The longer this crisis goes on, the more persistent the second-round effect will be. According to Bimco the impact of the current crisis has already become more severe than Ever Given and if it continues we are talking 1956 Suez Crisis scale.
We note that historic goods trade patterns from China to the US and Europe are currently working against a rise in freight rates, but once we get to March/April it switches, which will fuel freight rates all the way to October. That means 1-1.5 months to resolve the Red Sea matter. Looking at you Israel
Chart 4.a: Seasonal effects start to kick in in March/April from US goods imports

Chart 4.b: .. As well as in Europe

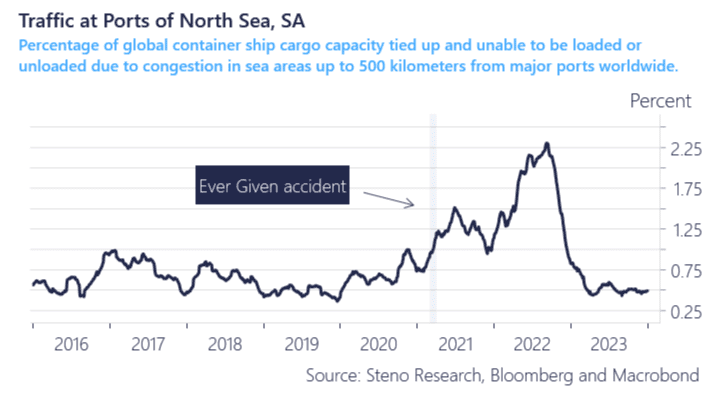
If/when the Red Sea issue is resolved and container ships go through the canal again, we will not be out of the woods yet, as there will be a congestion problem of container ships from the Cape of Good Horn route meeting with container ships from the reopened Suez Canal route causing jams at ports. Again the Ever Given accident serves as a good example. Post Red Sea issues, we could easily envision a scenario where the ripple effects last months after the Suez issue has been resolved.
Chart 5: Once the Red Sea issue is over, we are not quite out of the woods

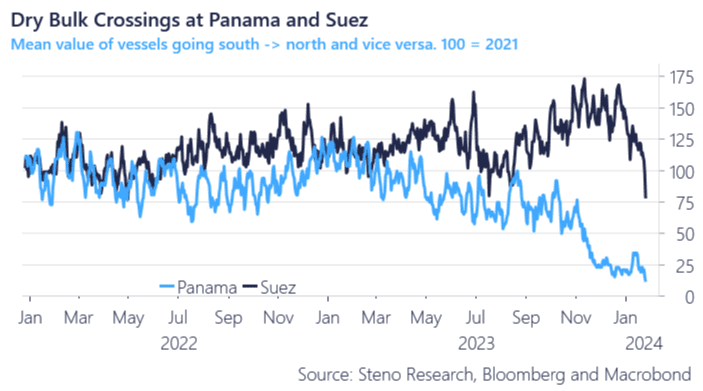
We have covered the issues in container markets but there are also interesting things going on in other parts of the shipping market. It is far worse in dry bulk shipping. In the Panama Canal dry bulk has been hit by low water levels and it seems like dry bulk is now also starting to avoid the Red Sea. We entered a long position in Wisdomtree Commodity Securities ETC (Ticker Code:Copa) last week which we haven’t regretted given everything sketched above.
We also note that LNG transits in the Suez have nosedived, but given the global demand situation and natural gas storage levels, we haven’t seen any energy markets affected. For crude oil, the Houthis still let VLCC through the Suez hence crude’s range bound trading between 75-80 USD throughout Jan even amidst all the troubles. Watch out for crude to break above USD 80 on the back of rising inflation expectations in the US, however (See 5y5y inflation breakeven over the last month).
The energy space is the final shoe to drop in the Suez malaise, but it is hence also the most likely sequential surprise from here given that.
The weekly EIA report hints of material draws on inventories again, which is a strong hint that demand is strengthening relative to supply in the oil space as well now. Congestion numbers also continue to support that notion.
We are close to buying energy again.
Chart 6.a: Dry bulk shipping at key canals has nosedived

Chart 6.b: LNG shipping is also down, but so is demand along with strong storage levels

Chart 6.c: EIA numbers hint of large drawdowns of inventories 


0 Comments