Macro Nugget: Two major waves of liquidity left this year of varying quality


This special macro nugget gives you an idea of the articles that we regularly produce when covering markets. This piece was published last week, where we focused on liquidity going into the CPI release. We hope you enjoy it!
We have examined the liquidity outlook for the remainder of the year. I have had numerous discussions with social media macro pundits who have “democratized” the net Fed liquidity measure and treat it as gospel for predicting daily flows in risk assets.
The short answer is a resounding no. We must remember that liquidity is a byproduct of fiscal and monetary policy decisions. Therefore, the important part of the analysis is to understand why liquidity is moving, not just if it is moving.
Depending on the type of liquidity additions/withdrawals, the quality of the liquidity signal improves/worsens as a driver of asset markets. We rank the largest liquidity items by importance in the following order. The higher on the leaderboard, the more “permanent” the liquidity is.
1) SOMA-holdings (QE)
2) ON RRP
3) BTFP / Discount Window
4) TGA
Let’s have a look at the details.
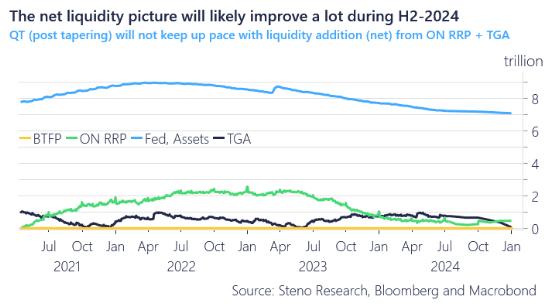
Chart 1: The liquidity outlook looks solid for 2024
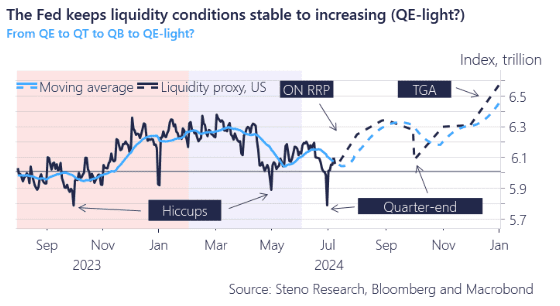
The first wave of liquidity will arrive over the coming 6-8 weeks via a continued depletion of the ON RRP facility. We consider this a “high-quality” addition to the liquidity pool due to it’s semi-permanent character, and as actual deposits in the real world are added along the way.
When a money-market fund buys a t-bill issued by the US Treasury, a net deposit of the same size will be added in the real-world, once/if the US Treasury spends the USD instead of parking it on the TGA. Given that we are within spitting distance of the target level on the TGA, the Treasury issues to spend over the next 6-8 weeks.
Over the course of July, the U.S. Treasury anticipates returning short-dated bill auction sizes to levels at or near the highs observed in February and March.
This expected increase in bill issuance is projected to lead to a marked depletion of the ON RRP facility in July and August, bringing its levels closer to the de facto floor. While firm evidence is still pending, preliminary tests suggest that the true floor level for the ON RRP could be several hundred billion USD below the current levels.
The upcoming six weeks will be crucial in testing this hypothesis, as the market adjusts to the increased net issuance of Treasury bills.
Chart 2a: Net issuance of bills up -> more liquidity
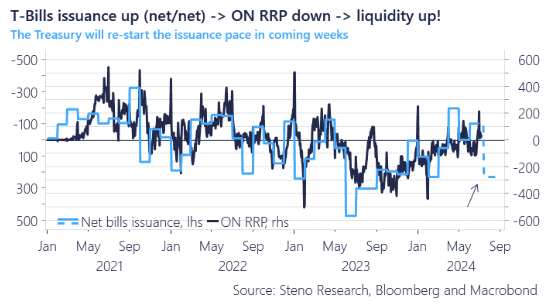
Chart 2b: Issuance of bills approaching February territory again
The second wave of liquidity is expected to arrive towards the end of the year as the TGA will need to be rapidly reduced to levels seen when the US debt ceiling was suspended in June 2023.
This drawdown of the TGA is intentional into year-end, as the US Treasury is not allowed to incentivize politicians to delay negotiations by maintaining a high balance in the TGA while negotiations approach the early January 2025 deadline. Currently, the TGA is below the official target levels ($760 billion versus $850 billion), but if liquidity moves from the ON RRP to the TGA during July and August, it is seen as a net positive due to the TGA’s more temporary nature.
The liquidity addition from the TGA is of lower quality compared to the ON RRP, as the former is temporary by design unless the long-term target for the ON RRP is changed.
The Treasury, by the way, will NOT forecast a reduction of the TGA as they have to gullibly assume that the debt ceiling suspension is fixed well in advance of the deadline, which basically never happens.
Official TGA projections for Q3 and Q4 are hence utter horseshit (pardon my French).
Chart 3a: TGA around debt ceiling suspensions
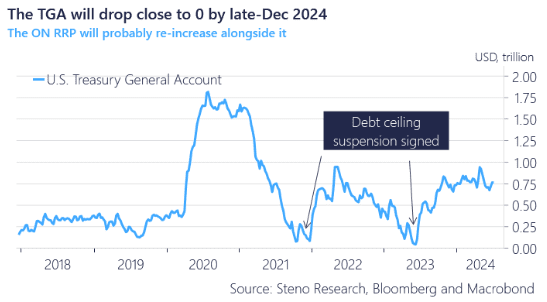
Chart 3b: Projected values for the most important liquidity drivers
In the charts below, you will find the empirical betas associated with the addition of USD liquidity in the financial system. This is good news for high-beta risk assets, particularly for the Consumer Discretionary sector.
In the foreign exchange (FX) space, this generally spells bad news for the USD. Specifically, USDJPY and USDSEK are highly sensitive to changes in liquidity.
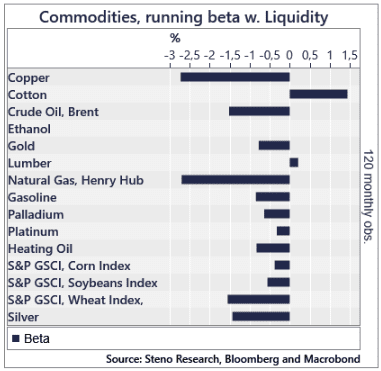
In the commodity space, the conclusions are somewhat counterintuitive. The addition of liquidity tends to be somewhat negative for the broader commodity asset class, particularly for Copper and Natural Gas. This is likely because liquidity is often increased due to political decisions when growth momentum is weak. This aligns with the current trends we are observing for July and August this year.
Chart 4a: Liquidity betas for Equities
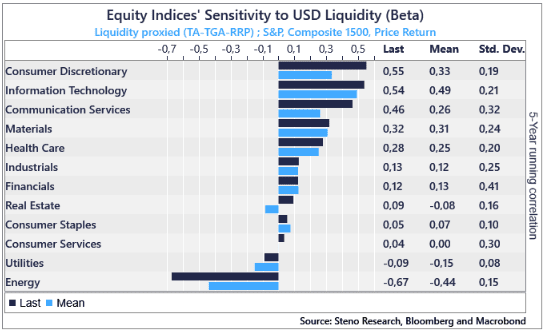
Chart 4b: Liquidity betas for FX pairs
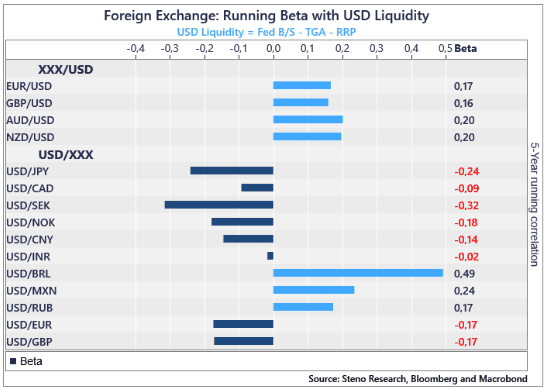
Chart 4c: Liquidity betas for Commods
0 Comments